Almost a third of tamariki and rangatahi in Aotearoa are Māori
The population of Aotearoa New Zealand aged 0–18 is 1.2 million
330,600 of those are tamariki and rangatahi Māori17
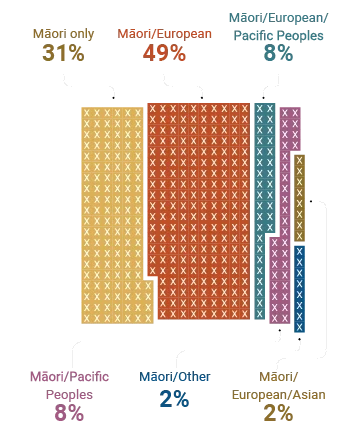
This report focuses on tamariki and rangatahi Māori. We define this group as anyone who identifies as Māori, including where they also identify as other ethnicities.16 Sometimes we compare this group to the non-Māori population, which we define as anyone who does not identify as Māori. Some data sources we use record each individual ethnicity that tamariki and rangatahi identify as, whereas others identify only a single ethnicity – for example, NZ Police data. In these cases, we are unable to identify if tamariki and rangatahi identify with more than one ethnicity.
When ethnicity is recorded as ‘unknown’ in the data sources we use, we have excluded these records from both Māori and non-Māori groups. When there is a large number of unknowns, we have reported these as a separate group.
The population of Aotearoa New Zealand aged 0–18 is 1.2 million
330,600 of those are tamariki and rangatahi Māori17
Ethnicity is the ethnic group or groups a person identifies with or has a sense of belonging to.
A person can belong to more than one ethnic group.18
Māori as proportion of the total youth population in each age group
| Age 0-4 | 30% |
| Age 5-9 | 27% |
| Age 10-14 | 27% |
| Age 15-18 | 26% |
Māori 0-18 years old
| Female/Wahine | 49% |
| Male/Tāne | 51% |
| Another gender | He ira kē anō | less than 1% |
One in five tamariki and rangatahi Māori who have had an interaction with the oranga tamariki system can speak te reo Māori – this is about the same as the total Māori youth population
![]()
In the 2023/24 reporting year:
| Māori | Non-Māori | Ethnicity unknown | |
|---|---|---|---|
| Tamariki and rangatahi in Aotearoa* | 28% (330,600) | 72% (864,700) | |
| Had a report of concern about their safety or wellbeing | 49% (26,300) | 37% (20,000) | 14% (7,300) |
| Were receiving some form of intervention from Oranga Tamariki (as the outcome of a report of concern, was that further action from Oranga Tamariki was required) | 54% (17,100) | 37% (11,900) | 9% (2,800) |
| Were in custody/care under care and protection orders | 67% (3,450) | 33% (1,650) | |
| Have transitioned into adulthood** within the year | 68% (380) | 32% (180) | |
| Police proceedings involved tamariki and rangatahi ** | 41% (3,500) | 28% (2,400) | 31% (2,600) |
| Were in custody/care under youth justice orders** | 78% (460) | 22% (130) |
* 2023 Census national and subnational usually resident population aged 0–18
** Tamariki and rangatahi aged 10–18
| Placement type | 2021/22 | 2022/23 | 2023/24 |
|---|---|---|---|
| Family/whānau | 45% | 41% | 39% |
| Non-family/whānau | 14% | 14% | 14% |
| Home (return/remain home with parent(s)) | 13% | 15% | 14% |
| NGO/Iwi social services | 10% | 9% | 9% |
| Other21 | 5% | 7% | 8% |
| Not recorded | 7% | 7% | 7% |
| Independent living | 3% | 2% | 3% |
| Residence | 2% | 3% | 3% |
| Family / Supervised Group / Specialist Group Homes | 2% | 1% | 2% |
| Māori tamariki / rangatahi | non-Māori tamariki / rangatahi | |
|---|---|---|
| < 1 year | 16% | 17% |
| 1-5 years | 30% | 37% |
| > 5 years | 54% | 46% |
16 In the case of younger tamariki, ethnicity is usually identified by a parent or guardian on their behalf.
17 Māori population is calculated based on the number of people who identify as Māori.
18 Stats NZ - ethnicity (detailed single / combination), age, and gender for the census usually resident population count, (RC, TALB, SA2, Health), 2013, 2018, and 2023 Censuses.
19 https://www.stats.govt.nz/news/one-in-three-children-projected-to-be-maori/
20 During the year 1 July 2023–30 June 2024
21 Other placements include boarding schools, bespoke placements, and where rangatahi remained living with caregivers beyond the age of 18 years old.
22 Stats NZ (2025). Household Disability Survey 2023 - findings, definitions, and design summary. https://www.stats.govt.nz/assets/Reports/Household-Disability-Survey-2023-findings-definitions-and-design-summary/Download-data/household-disability-survey-2023-findings-definitions-and-design-summary.pdf